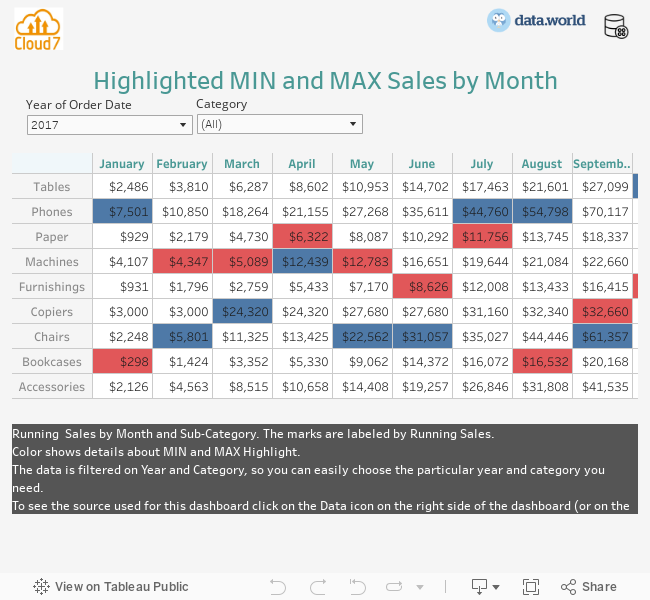
Minimum and Maximum Sales Highlighted by Month
This dashboard shows the number of sales by category and sub-category with the minimum and maximum figures color-coded by month and year. A user can use the Year and Category filters to explore the data.
Share this with your friends