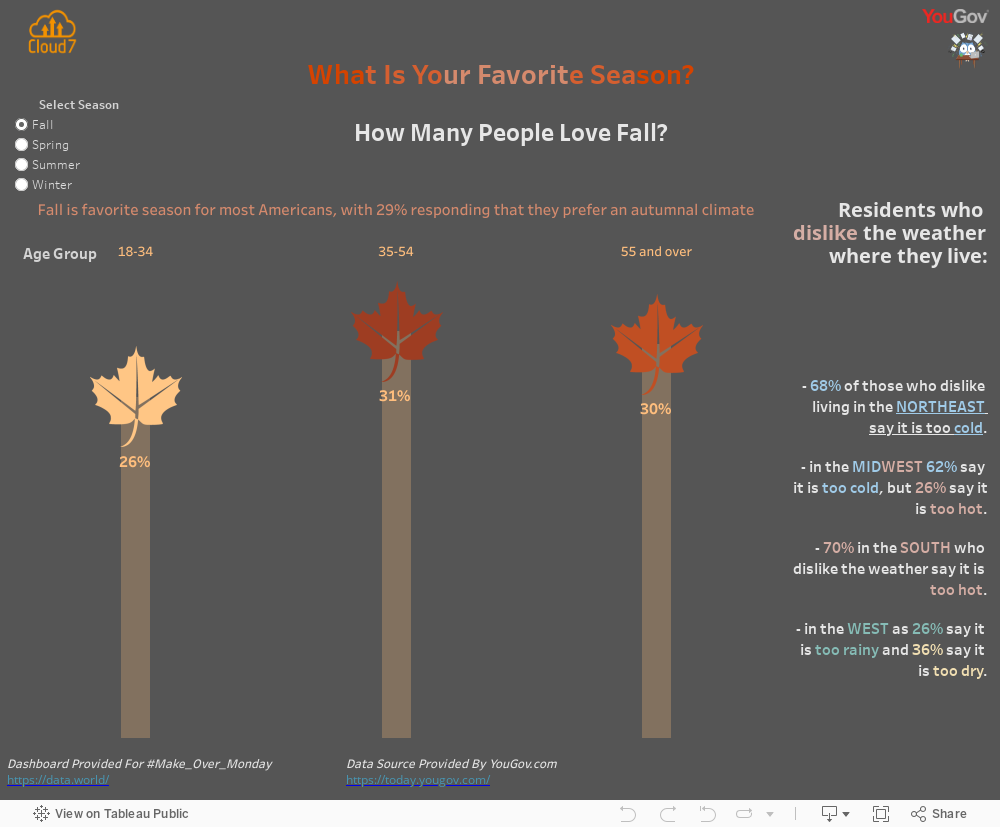
Seasonal Preference
This viz helps to find out what is Americans’ favorite season by each age group. In this case we know, that, for example, spring is the favorite season for people in the 55 and over age group, but people from the 18-34 age group prefer the summer season. The applied filter helps you to switch between seasons and to take a look at our analytics.